Viewing activity data
All the activity courses at your school are listed on the Courses page. Your latest activity courses are listed also on Dashboard. For more information, see Viewing activity courses.
- Go to Courses.
- Find the course on the course lists (Ongoing courses/Finished courses), or use the search.
- Click the row or the icon
 to open the course.
 - The Weekly activity page shows the following Course information:
- number of students,
- average active time in minutes compared to target active time (for example, 65/90 min),
- teacher,
- evaluation type,
- start date, and
- end date.
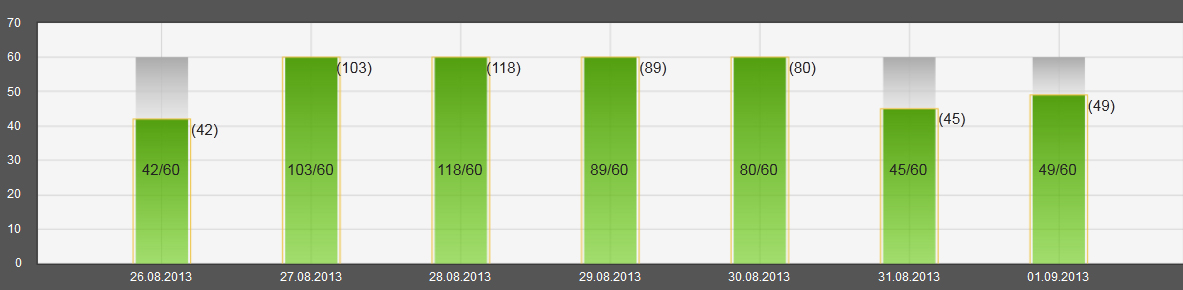
- Select All students on the Student information drop-down list to review the daily group averages for the whole course as bar graphs. Up to seven days' activity bars are displayed simultaneously. Browse through the weeks with the arrows above the bar graph area. The bar graph area shows the following information:
- the bar is the daily activity target, and
- the colored part of the bar is the group average result for the day.
This information is also shown as a tooltip text when you hover over any of the bars.
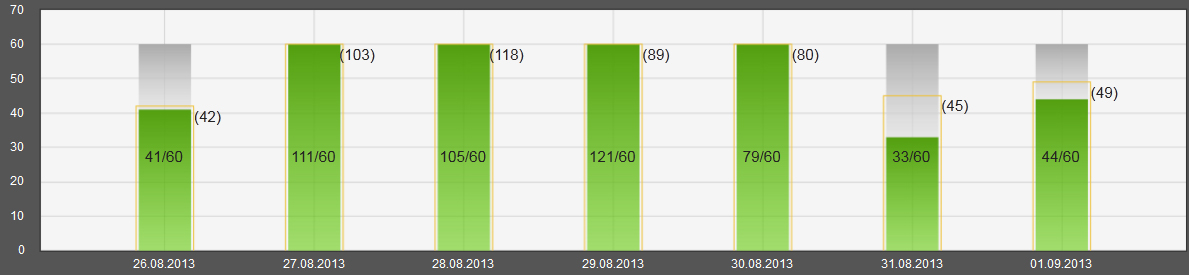
- Select one student on the Student information drop-down list to review the daily results for the selected student as bar graphs. Up to seven days' activity bars are displayed simultaneously. Browse through the weeks by using the arrows above the bar graph area. The bar graph area shows the following information:
- the bar is the daily activity target,
- the colored part of the bar is the student's daily activity result, and
- the colored frame on the bar is the group average result for the day.
This information is also shown as a tooltip text when you hover over any of the bars.
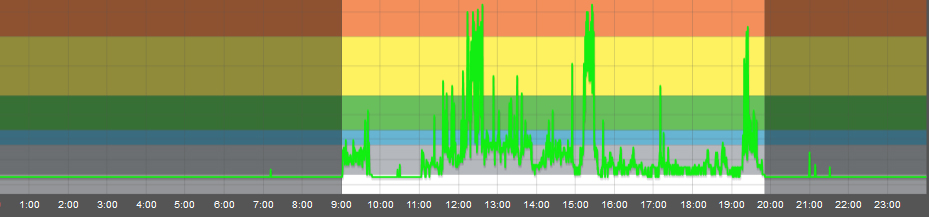
- Click View daily activity to review the selected student's daily activity in detail. Each day's activity data is displayed as a curve graph. Alternatively, you can click any of the bars in the weekly bar graph to view the curve graph displaying the selected student's activity data on that particular day. Move between the days with the arrows above the curve graph area. You can change the student from the Student information drop-down list. In addition to the daily activity curve, the Daily activity page shows the following information:
- active time in minutes compared to target active time (for example, 65/90 min),
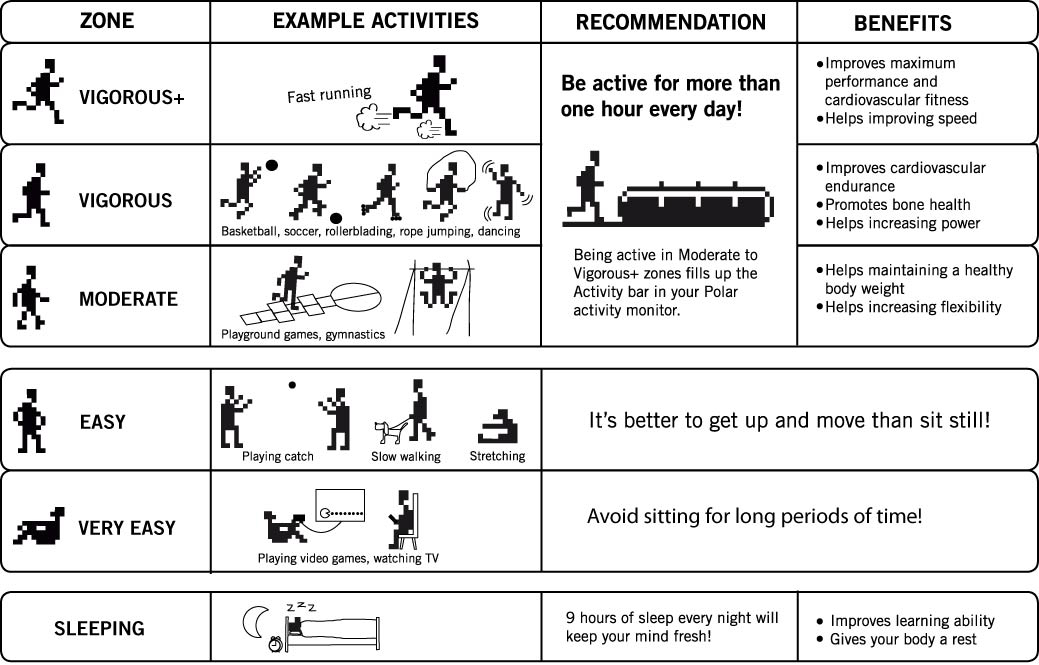
- time spent in the different activity zones (the Vigorous+, Vigorous and Moderate zones fill up the daily activity bar),
- time spent in the sleeping zone,
- calories and steps,
- automatic evaluation based on the selected evaluation type and student's total score of daily activity.
 You can print the activity curve by clicking Print activity curve above the curve. The curve is printed as a PDF file which can then be saved on the computer or printed on paper.
 - Return to the bar graph page by clicking Back to weekly activity.
You can use, for example, the following questions to discuss the activity data with your students:
- How did you get your activity bar filled?
- How did you get time for each activity zone?
- What could you do to gain more active time?
You can also make a plan for an active day/week, and then discuss the planned and actual hours/minutes.
 For more information on how to analyze activity data, see Analyzing activity information in the Lessons for Life book.